Latent Space / Kill My SaaS report

Four graphics to borrow.

Image-generated editorial charts using the saved survey and review aggregates. Open an image for full resolution. The project-size graphic shows selected planning examples, not a distribution of submissions.

Exact aggregate data · Estimate methodology and examples · 23 worked examples

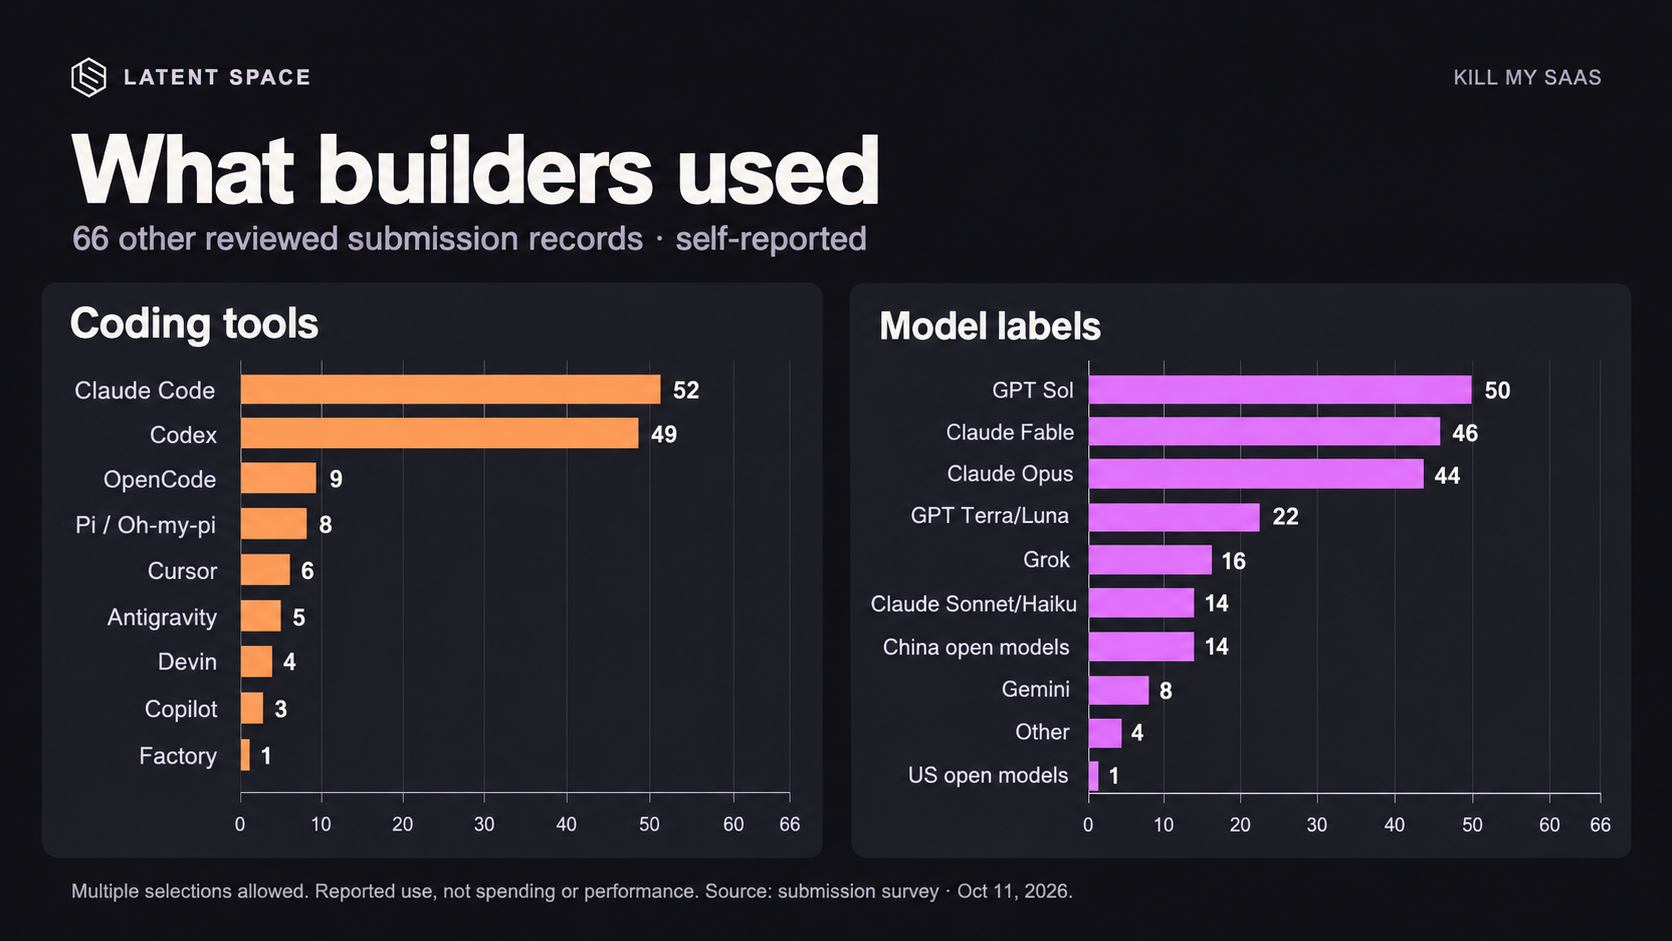
Reported coding tools and model labels

66 other reviewed records. Multiple selections allowed; counts measure reported use, not spending, time or performance.
66 other reviewed records. Multiple selections allowed; counts measure reported use, not spending, time or performance. Download PNG

Claude Code and Codex overlap
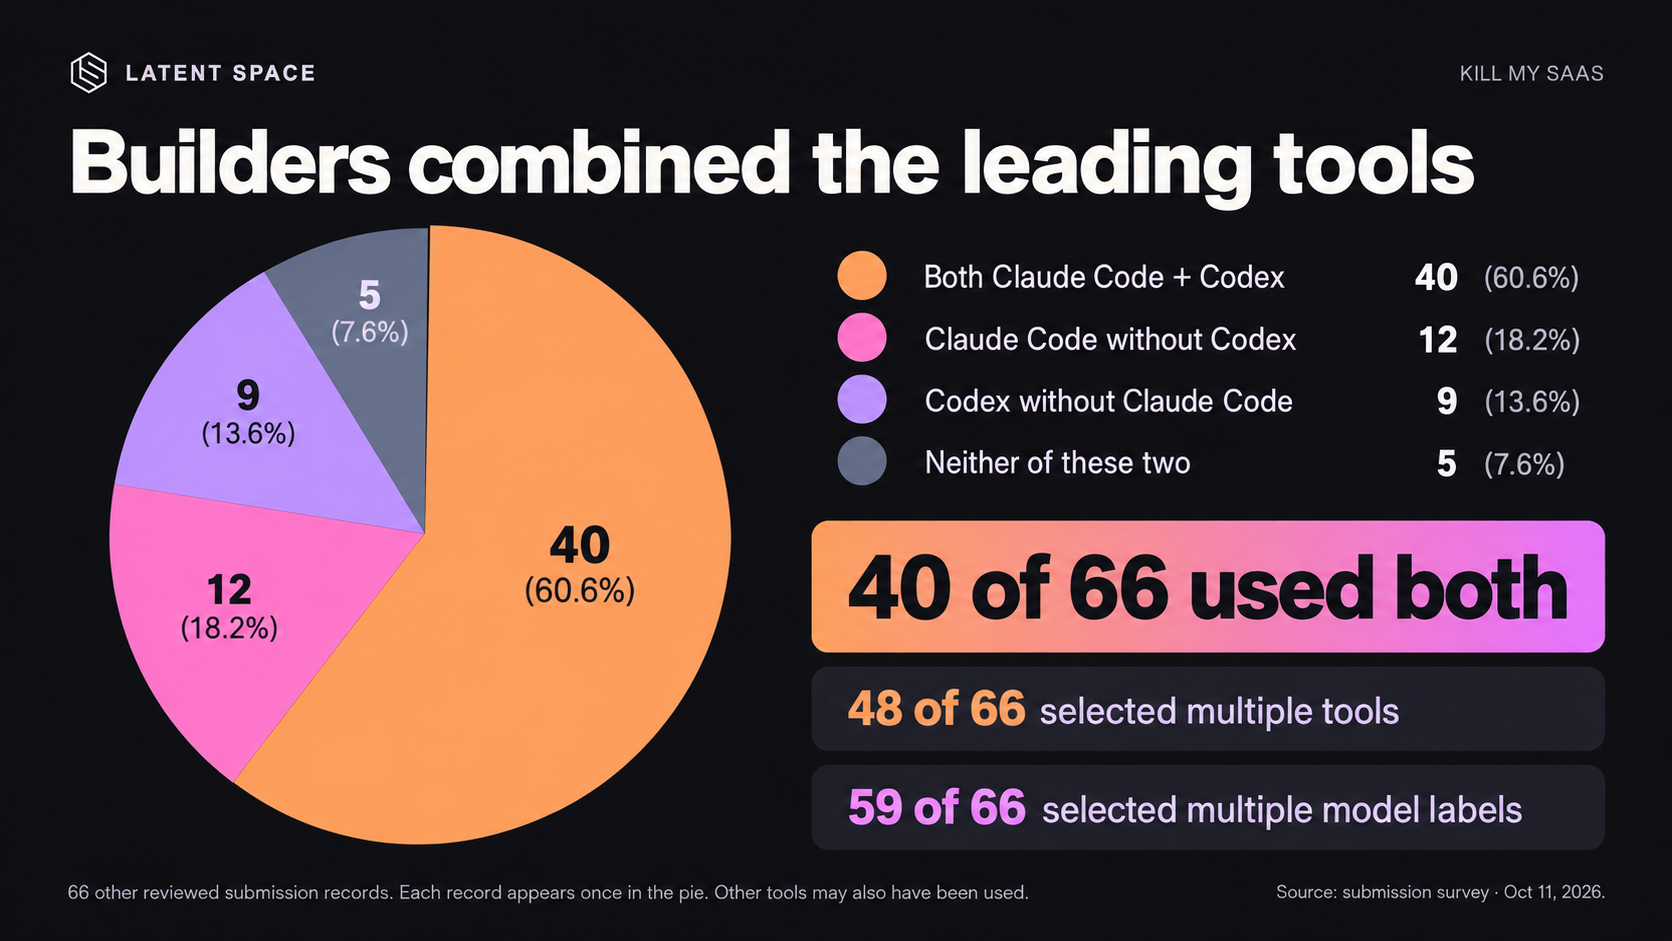
Both 40; Claude Code without Codex 12; Codex without Claude Code 9; neither 5. Each record appears once; other tools may also be used.
Both 40; Claude Code without Codex 12; Codex without Claude Code 9; neither 5. Each record appears once; other tools may also be used. Download PNG

Recurring review topics
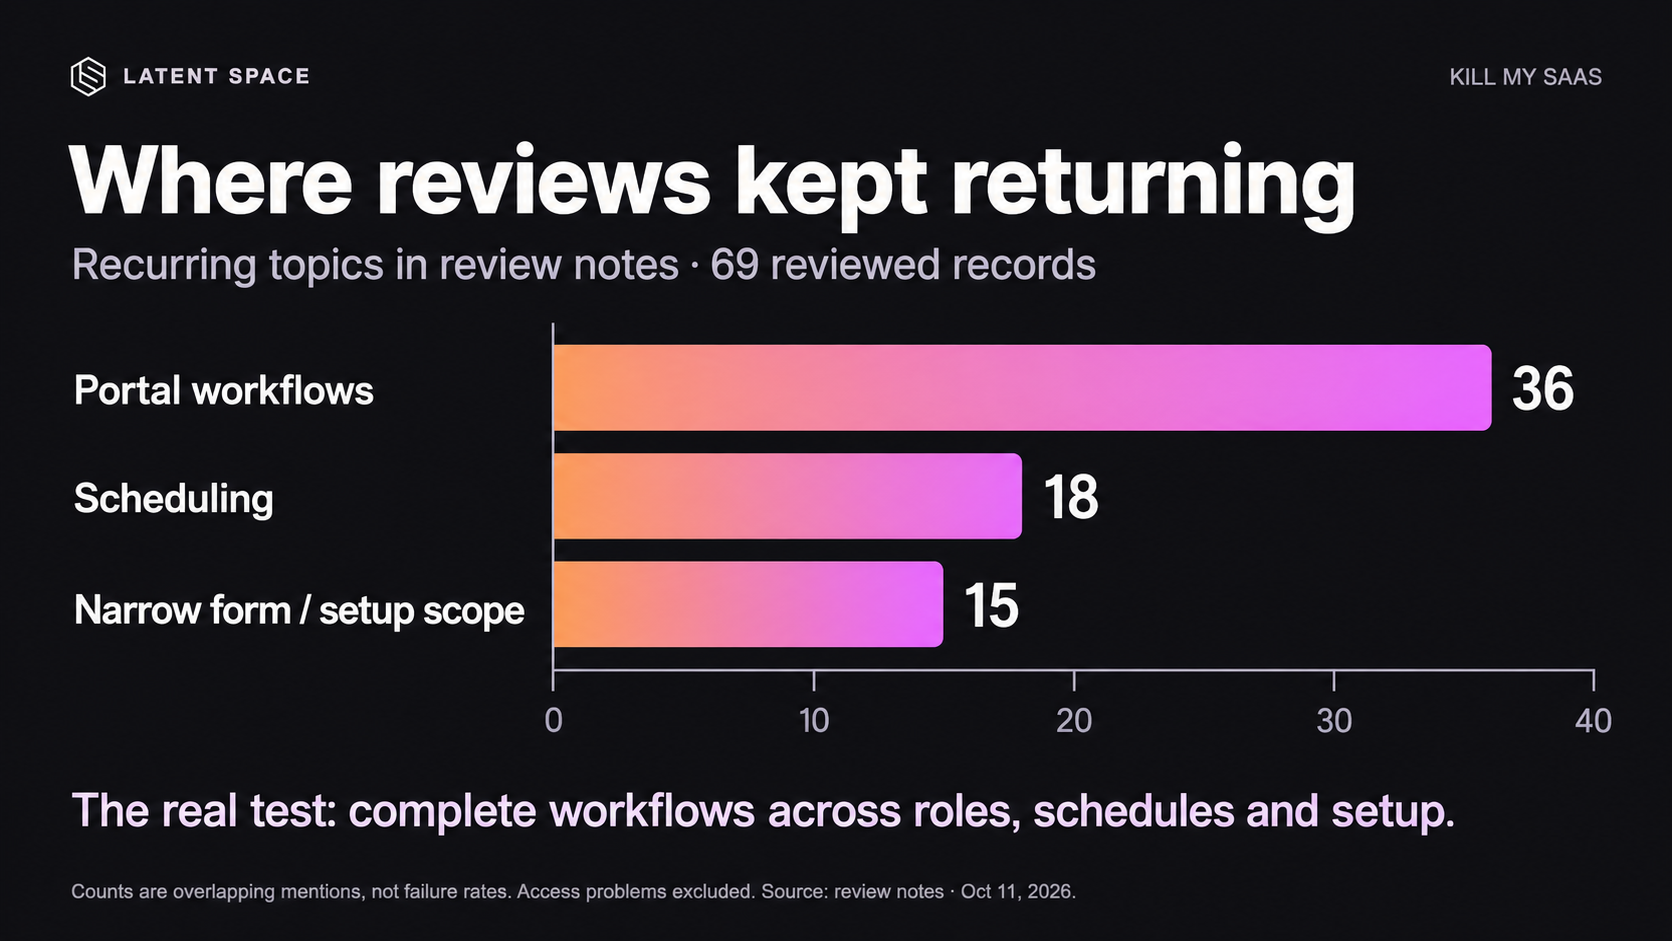
Portal workflows 36, scheduling 18, narrow form / setup scope 15. Overlapping mentions across 69 reviewed records, not failure rates. Access issues excluded.
Portal workflows 36, scheduling 18, narrow form / setup scope 15. Overlapping mentions across 69 reviewed records, not failure rates. Access issues excluded. Download PNG

Small / medium / large planning estimates
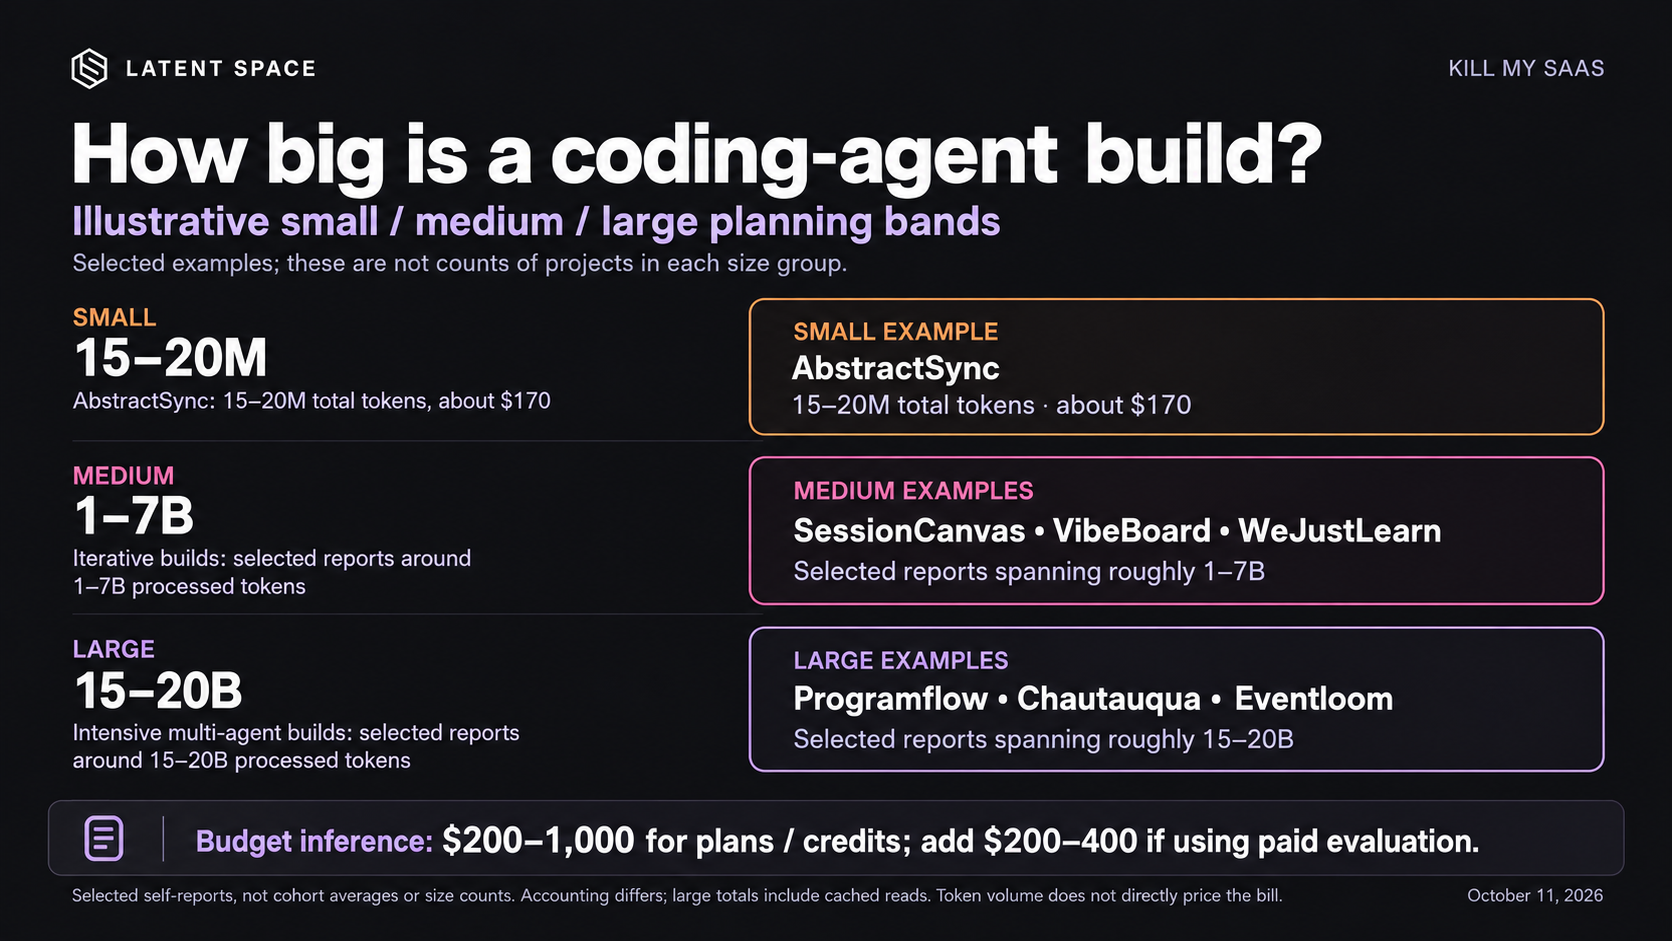
Illustrative token bands from selected reports: small 15–20M, medium roughly 1–7B, large roughly 15–20B. These are not cohort size classifications. Large totals include cached reads; accounting differs. Budget inference is separate from the token bands.
Illustrative token bands from selected reports: small 15–20M, medium roughly 1–7B, large roughly 15–20B. These are not cohort size classifications. Large totals include cached reads; accounting differs. Budget inference is separate from the token bands. Download PNG